How do the Relative Price Increases impact Inflation? Worldwide View
Dec 15, 2023 By Triston Martin
Inflation and relative price increases are vital economic concepts often discussed but have distinct meanings and implications. To understand how economies function and how individual spending power is affected, it's crucial to grasp these concepts.
What is Inflation?
The buying power of money declines when inflation raises prices for goods and services. Central banks regulate inflation and avert deflation to maintain the economy. It measures the rate at which an economy's basket of goods and services' average price level rises.
The Mechanism of Inflation
Inflation happens when an economy's prices rise over time. The Consumer Price Index (CPI) and Producer Price Index (PPI) measure the average change in consumer and producer prices over time.
Causes of Inflation
- Demand-pull inflation: It occurs when an economy's demand for goods and services exceeds supply. Many call it "too much money chasing too few goods." Demand increases prices in such cases.
- Cost-Push Inflation: Rising manufacturing costs reduce supply. This may be due to increasing labor, raw material, or other input expenses. Producers raise prices to cover these expenses.
- Monetary Inflation: Money supply affects monetary inflation. As a central bank injects cash into the economy, currency value may fall, causing inflation. Classic currency depreciation raises prices.
Inflation Expectations
Expectations of future inflation can also play a role. If businesses and consumers expect higher inflation in the future, they may increase prices and wages in anticipation, creating a self-fulfilling prophecy.
Global Influences
Global events can also influence inflation. For instance, increasing oil prices can lead to higher transportation and production costs worldwide, contributing to inflation.
What are Relative Price Increases?

Relative price increases refer to the rate at which the price of a specific good or service increases about others. Unlike inflation, which looks at the big picture, relative price changes focus on particular sectors or products. These changes can be influenced by supply and demand, production costs, and market competition.
While inflation is a macroeconomic concept, relative price increases focus on the microeconomic aspect.
Causes of Relative Price Changes
- Supply and Demand: Supply and demand determine relative price fluctuations. A new technology may enhance the demand for certain abilities, raising earnings in that industry quicker than others.
- Sector-Specific Factors: Different industries have unique factors affecting their pricing. For example, agricultural products might see price changes due to weather conditions, whereas technological goods might be influenced by innovation or changes in consumer preferences.
- Regulatory and Tax Changes: Government policies like taxation and regulation can also impact relative prices. For instance, an increase in taxes on tobacco products will likely cause their prices to rise more than other goods.
- Global Market Influences: Global events can disproportionately affect specific sectors. For example, a disruption in oil supply can significantly increase fuel costs, impacting industries reliant on transportation more than others.
Inflation Vs. Relative Price Changes

It's essential to differentiate relative price increases from inflation. While inflation denotes a general rise in prices, close price changes refer to the price movement of a specific good or service to others. A decrease in another might offset a relative price increase in one area, keeping overall inflation steady.
The Connection and Distinction
Inflation and relative price changes are intertwined yet distinct aspects of economic dynamics. Understanding their interaction is crucial for understanding economic trends and policy impacts.
Inflation Influencing Relative Prices
Inflation can set the stage for relative price changes. For instance, in an inflationary environment, specific sectors may experience higher price increases due to supply chain disruptions or increased demand. This results in relative price changes within the broader context of general inflation.
Relative Price Changes Contributing to Inflation
Conversely, significant relative price increases in key sectors can contribute to overall inflation. For example, a sharp rise in energy or food prices can lead to higher production costs across various industries, thereby feeding into the general inflation rate.
Sectoral Analysis
The impact of relative price changes can vary significantly between sectors. Some industries may be more sensitive to specific economic shifts, causing more pronounced close price changes. This is particularly evident in industries like technology, where rapid innovation can drastically alter prices, or in commodities, where supply and demand dynamics are pivotal.
Feedback Loops
There can be a feedback loop between inflation and relative price changes. For instance, if inflation expectations are high, businesses might raise prices preemptively, which can fuel further inflation. Similarly, significant relative price increases in a particular sector might lead to wage demands, contributing to broader inflationary pressures.
Policy Implications
Understanding the interplay between inflation and relative price changes is vital for policymakers. Central banks, for instance, monitor both aspects to make informed decisions about monetary policy.
Analysis of the U.S. Consumer Price Index
Since 2000, the Consumer Price Index (CPI) has shown intriguing changes in US consumer prices. The Bureau of Labor Statistics' CPI measures monetary value and cost of living changes.
Charting the CPI Journey
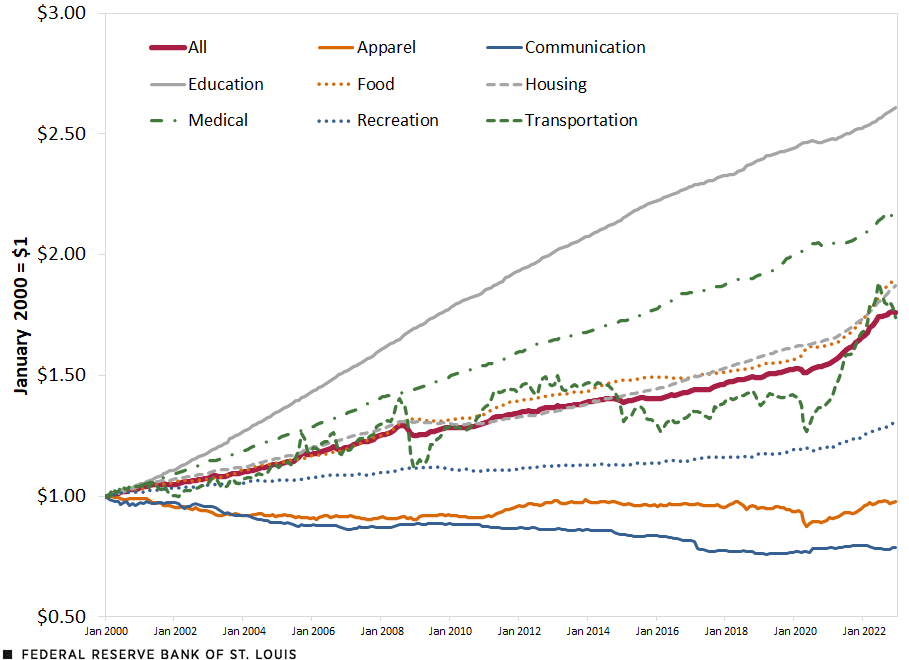
A line chart depicting the CPI from January 2000 serves as a telling visual guide. Each series in this chart is calibrated such that $1 in January 2000 forms the baseline, allowing for a precise comparative analysis over the subsequent years.
Decoding the CPI's Composition
The CPI encapsulates the cost of a diverse array of goods and services, typical for U.S. consumers. The “All” line, marked in solid red, aggregates the general price level for a comprehensive basket of goods and services. Other lines dissect this basket further, highlighting specific components like medical care (illustrated by a broken green line) and recreational expenses (shown by a dotted blue line).
Inflation's Story in Numbers
By December 2022, the “All” line ascended to approximately $1.80 from its $1 benchmark in 2000. This ascent symbolizes inflation's impact: what $1 could buy in 2000 now requires $1.80. The curve's steep rise post-mid-2020 particularly underscores the recent intensification of inflation.
Dissecting Relative Price Movements
What's notable is how some components of the CPI outpaced others. Education-related costs, for example, saw a dramatic increase, multiplying by 2.6 since 2000. In stark contrast, communication-related expenses dipped, underscoring the dynamic nature of relative prices amidst overall inflation.
Examining CPI since 2020
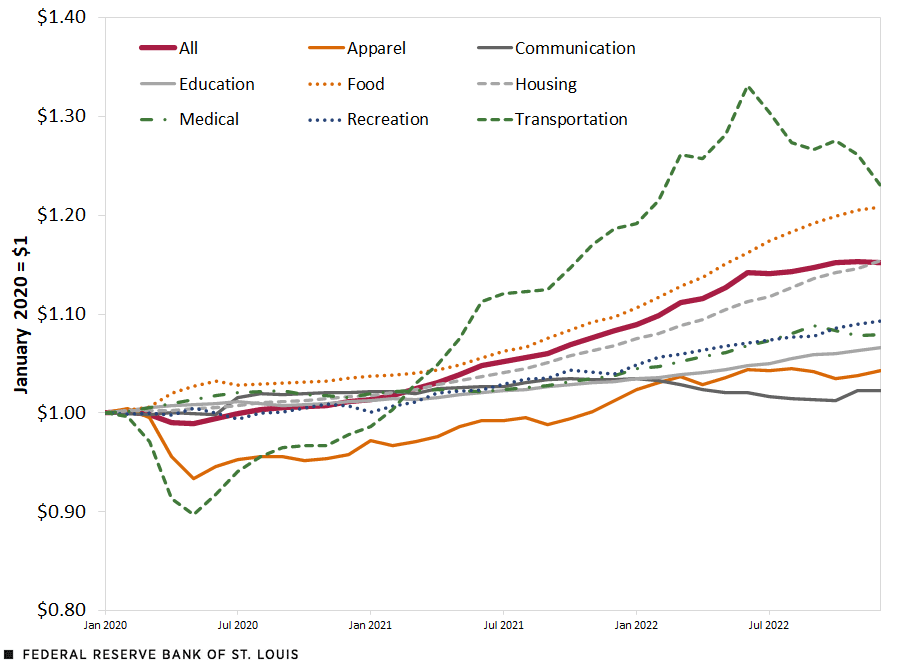
Shifting the focus to a more recent timeframe, starting from January 2020, we observe different trends in the CPI's evolution. The same methodology of the previous chart is applied here for consistency.
Rapidly Changing Sectors
In this more recent period, transportation and food expenditures (represented by dashed green and dotted orange lines) emerged as the categories with the most rapid price increases. This shift is exciting when contrasted with the long-term trends observed since 2000, where education and medical costs were more prominent in their growth.
The CPI's Dual Story
Collectively, these charts underscore a critical aspect of inflation. While the general price level (as seen in the “All” line) provides a broad view of inflation, the nuanced differences in various expenditure categories reveal the complex nature of price changes. Relative price shifts, sometimes masked by the overall inflation rate, are crucial in shaping consumer spending decisions.


